Problem

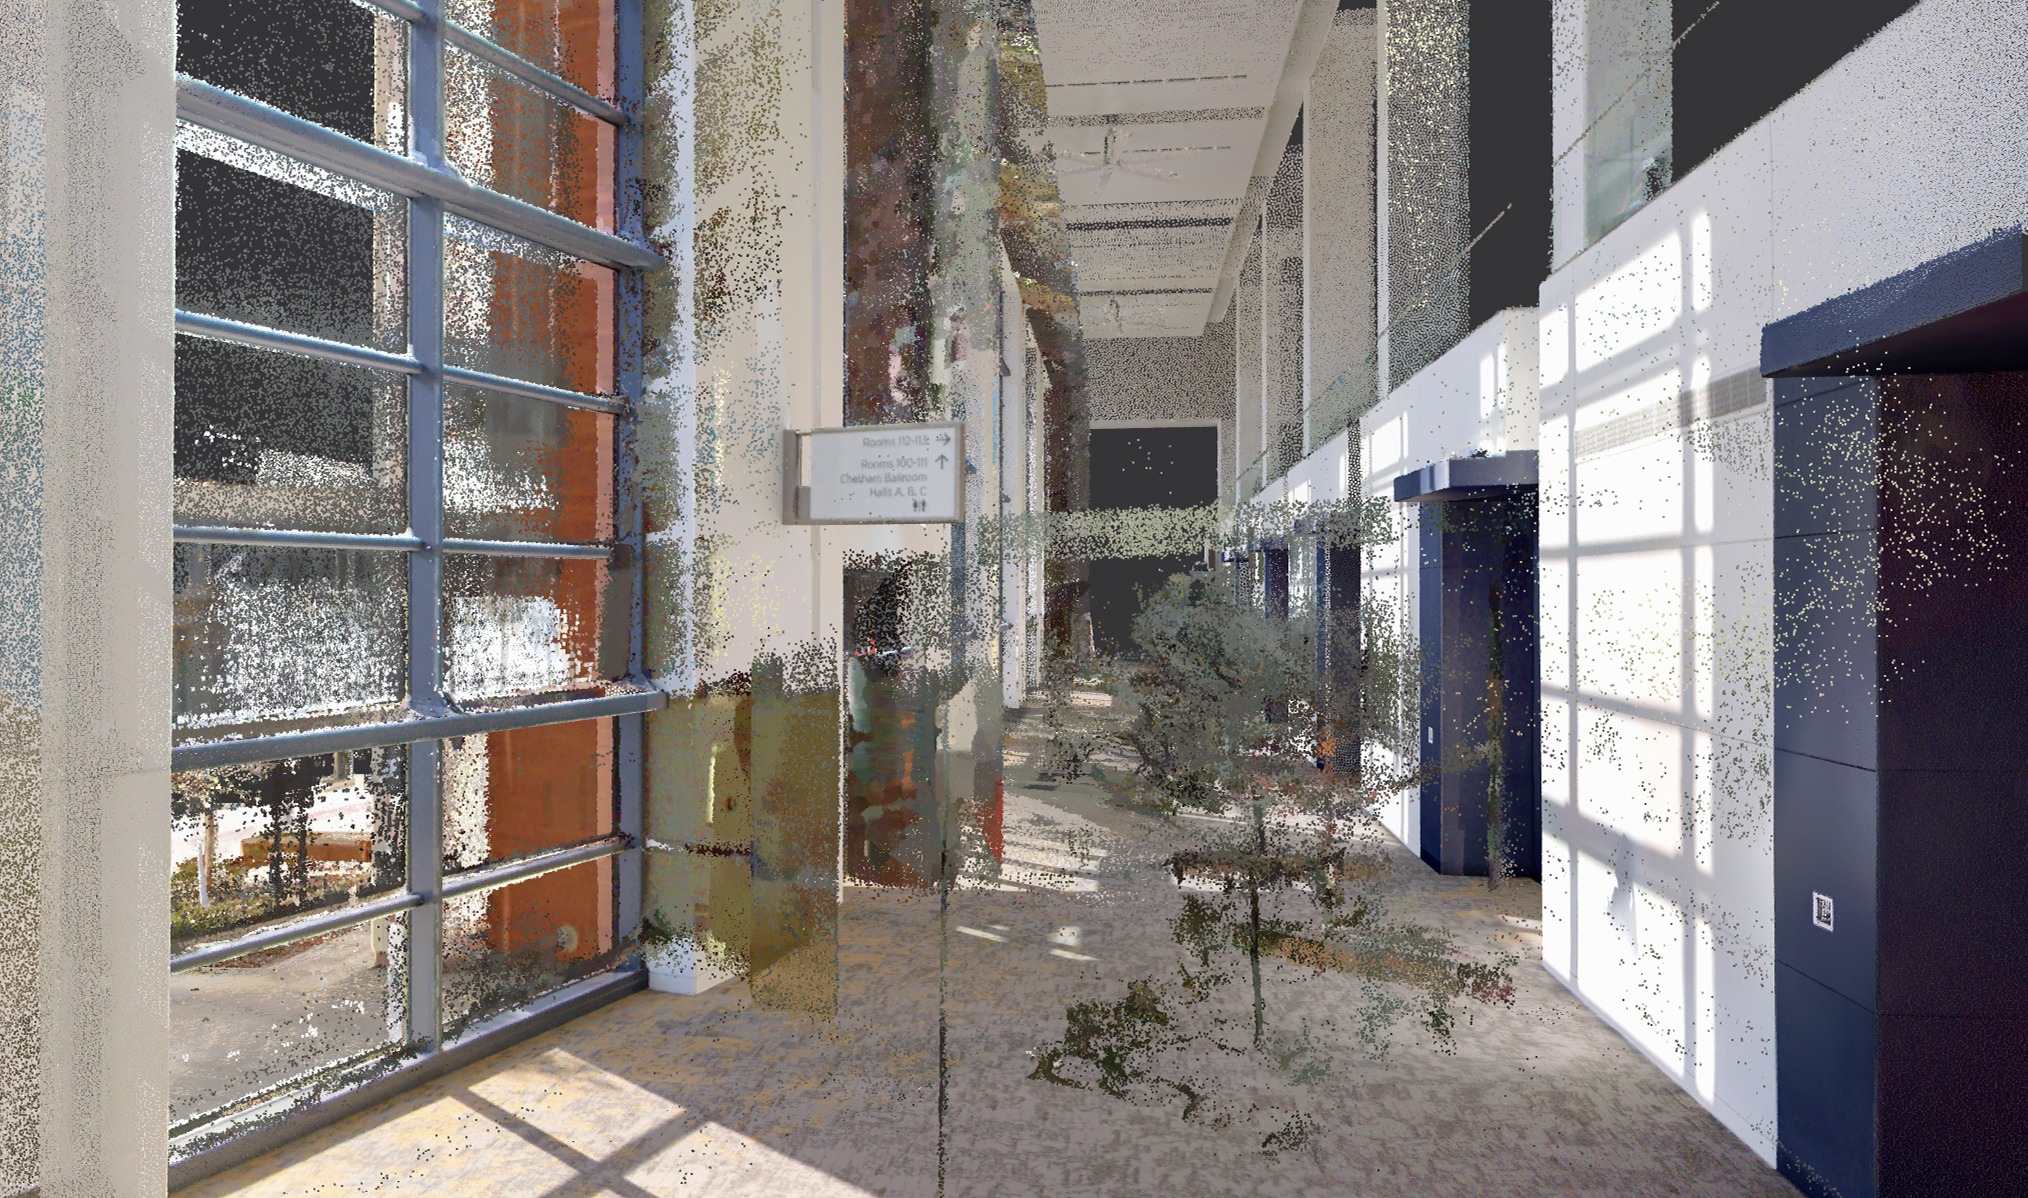
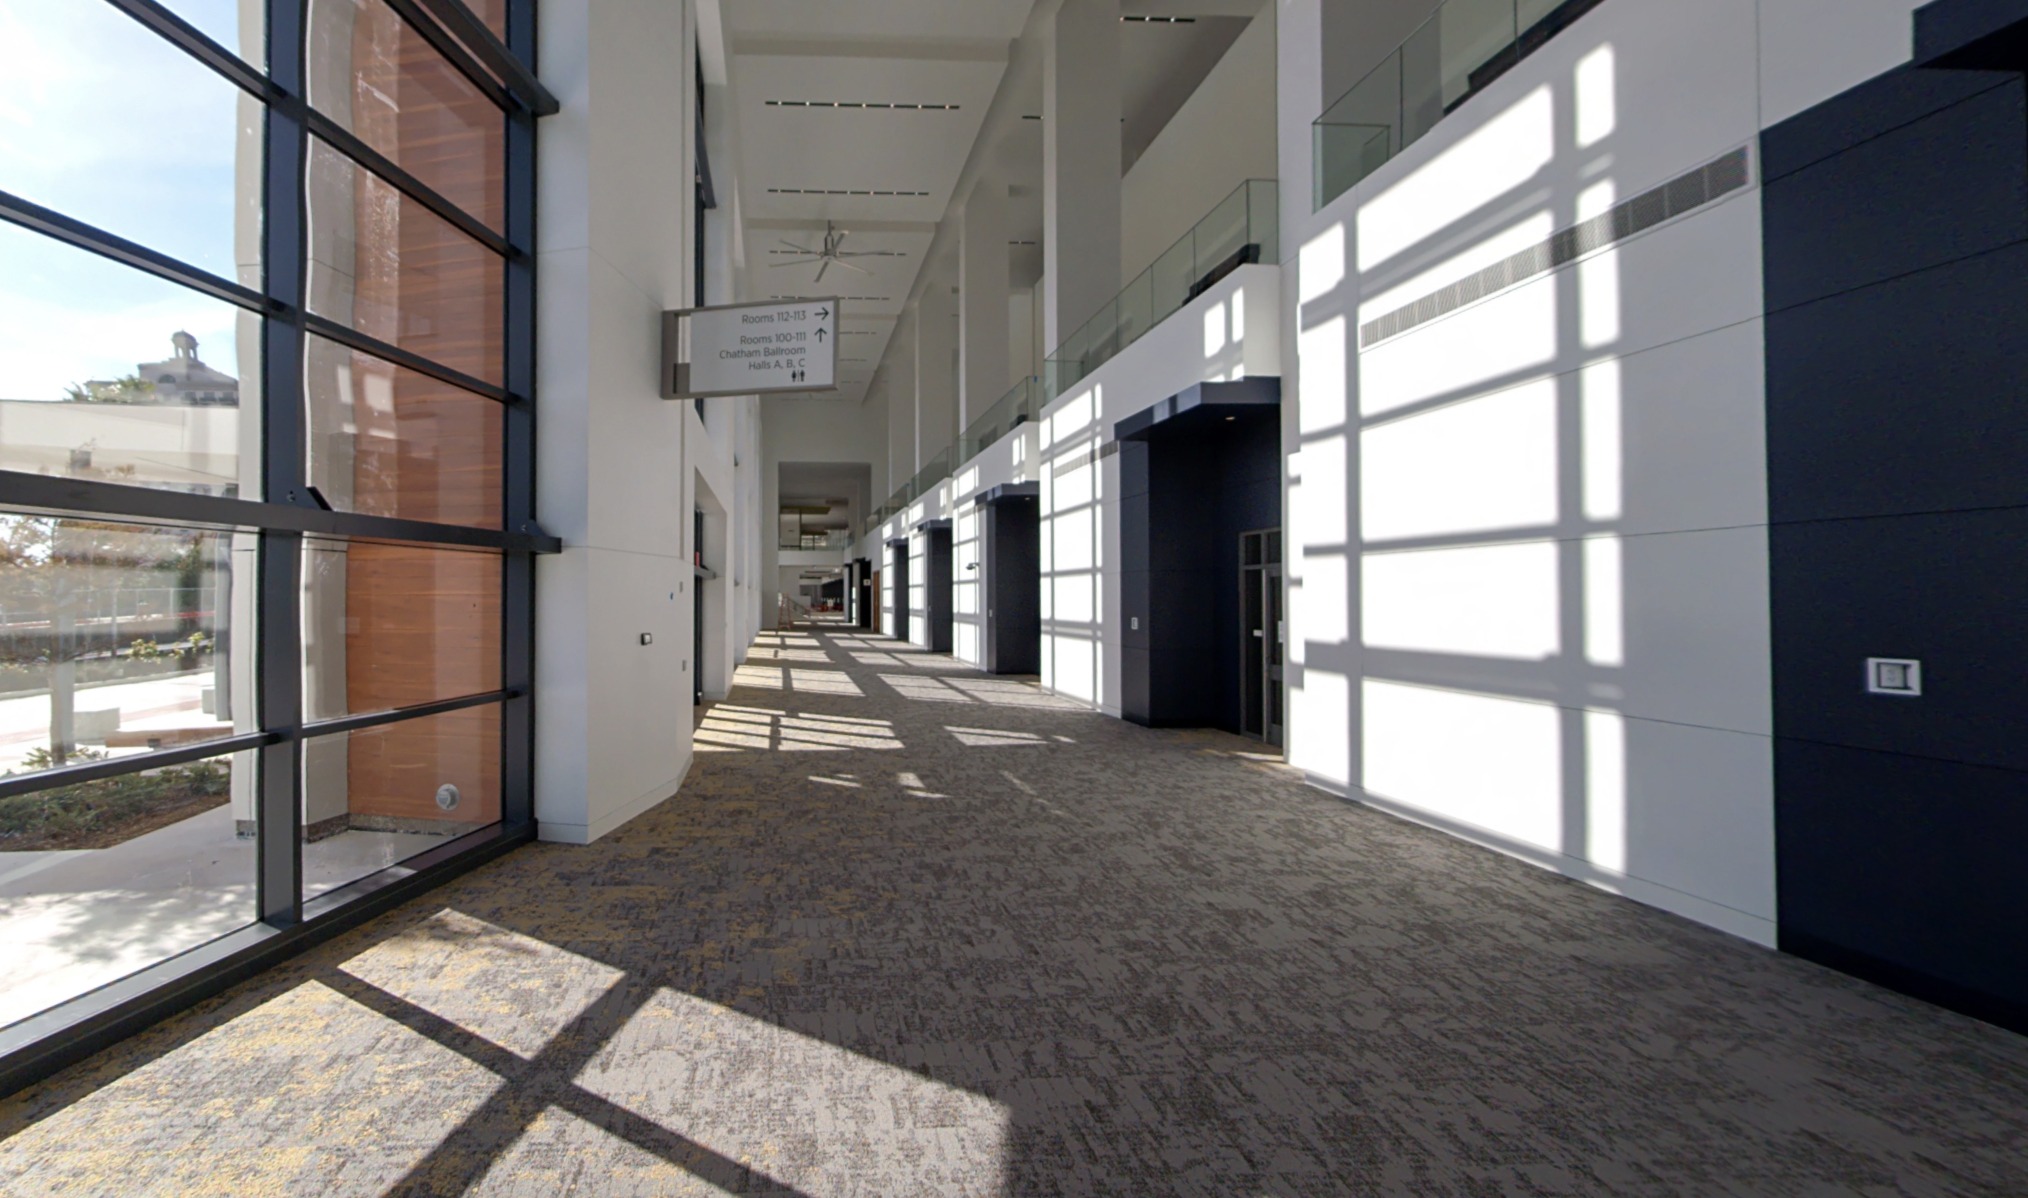
NavVis customers struggled with inaccurate point cloud data due to reflections and noise from SLAM scanning, causing costly additional softwares and time outside IVION.

Task

I designed and led the development of an intuitive manual cleanup feature levering pre-existing mental models to facilitate adoption

Success metrics

Task time is reduced by 30%;
Convertions rate 90% in 30 days;
25% retention rate.

Improved data quality and user satisfaction, operational costs are cut, positively impacting retention and business revenue.

Problem: Ghost points and reflections in ‘reality capturing’

Our current data capture process leads to inclusion of excessive and unnecessary points, resulting into inaccurate representation of reality and added workflow complexity. Additionally, the necessity to transfer data from NavVis IVION to other tools for point cloud cleanup results in a loss of connection to panoramas.

Several customers require the data captured to be transformed into BIM or mesh data. The inhability to remove these points in IVION forces the users to transfer the data to 3rd party softwares.

Below you can see a comparison beween the scan result and the actual site.

Focused research: What are customers doing to solve their pain points.

How is the problem solved today?

I started conducting competitors analysis and user research, looking at customers’ preferred tools for the job-to-be-done: Faro scene, Leica cyclone, Cloud Compare, and more.

With that I gathered questions to interview software experts and uncover improvement opportunities.

Takeaways:

Using different softwares outside of IVION to cleanup data leads to not only increased time on task and software costs, but also as the loss of panoramic images connection when bringing the data back into NavVis IVION.

Proposed solution:

Build and internal cleanup tool and not rely on APIs.
This will require more resources but will lead to higher customer satisfaction, engagement and adoption.

Competitors' logos

Competitors’ tools analysis table to understand what’s out there in the market and what our customer’s are using to clean up their data.

Designing a business oriented, scalable solution for the future of NavVis IVION

The solution should allow users to be fast but precise, and should also be non-destructive.

We can be fast and precise by leveraging existing mental models from competitors.
It should be non-destructive to allow non expert users to onboard without concerns for data’s safety.

I mapped users requirements based on the interviews.

Based on these criteria and the competitor’s analysis we focused our efforts on:

  • Orthographic camera implementation
  • Point cloud cluster selection among multiple scans
  • Crop view/bounding box
  • Hide and reverting any edits

The Orthographic camera in an industry standard that allows users more precise selection.
Point cloud cluster selection among multiple scans, will allow for faster and efficient workflow.
We can leverage the existing crop view tool in the software, thus saving time and resources.
By hiding and not deleting them we make the workflow non destructive.

How to introduce the solution to stakeholders and refinement

After familiarizing myself with the existing tools, I found a way to make the idea easy to digest quickly for all the colleagues who were not involved in the research.

I focused on a mix of figma prototypes and CloudCompare free software to show expected behaviour and general expectations

Comparison between cloudcompare limit box and selection flow, and an high level concept for point cloud cleanup in ivion.

I conducted an analysis of the different options to get to the solution, this oftens helps opening up the discussion and helps get the creative juices flowing.

Most often than not people can find even more refined ideas by looking at the different options to get to the same goal.

We aligned on few guiding principles though:

  • In doubt analyse the competition, we want to maximise adoption by offering familiar tools.
  • Don’t invest time in redesigning other features than the ones discussed to maximise resources
  • Users can interact only on what is visible, what is hidden should not be affected.

User requirements concepts discussion with tech leads to address feasibility and scalability

Validating the solution with Alpha and Beta testing

An interative approach for validation was chosen.

We defined two programs Alpha and Beta.
The first is an internal validation with industry experts and Customer success managers, the latter a feature flag release with selected customers.

We enlisted our point cloud cleanup experts to conduct 10 semi-structured, moderated usability testing interviews of around 60 to 90 minutes each to go over different key aspects.

We aimed at a CSAT score of around 85-90% to consider the alpha release ready.

Feedback result from alpha usability testing with prioritised issues based on scoping and timeline.

We reached a score of 94%. This gave our C-suite enough confidence to release the designed solution.

Given the success of the testing and the time available until the release deadline we prioritised the feedback and used the remaining sprints to further optimise the solution.

Some highligths include:

  • We removed unclear UI components and functionalities not common in IVION
  • Added an undo functionality
  • Introduced quick access to more funtionalities via contextual menus

New improved UI and UX based on the feedback received from the Alpha, additional features might be considered for future major releases.

How to capture the post release feedback

I aligned with the customer facing teams and leadership to setup a feedback repository.

Aside from jira which was used to collect the captured bugs and software issues, we used a combination of other quantitative and qualitative methods

I followed up with customer interviews with the ones who expressed the first feedback after release and created mixpanel dashboards to track, adoption, usage and churn.

Success, next steps and retrospective

After analysing the qualitative and quantitative data:
Task time is reduced by 30%;
Convertions rate 90% in 30 days;
and we achieved a stable 25% retention rate.

After the release the solution was further optimised within the next patch release addressing more feedback from the customers, including quick access to orthogonal views and better handling of edge cases.

In retrospect the two most pivotal moments in the project runtime were during the concept clarification and development of features like orthographic projection.

To adapt the communication style to the different stakeholder, has been crucial to the project success.

With regards to orthographic projection, the challenge proved to be simplifying the behaviour in relation to the perspective one, ensuring smooth transition in the eyes of non-expert users without adding more complext controls.